
QCustomplot使用分享(九) 绘制图表-多功能游标
2019-10-28 06:19:26来源:博客园 阅读 ()

QCustomplot使用分享(九) 绘制图表-多功能游标
目录
- 一、概述
- 二、效果图
- 三、源码讲解
- 1、源码结构
- 2、头文件
- 3、添加游标
- 4、监测移动
- 5、移动游标
- 6、其他函数
- 四、测试方式
- 1、测试工程
- 2、测试文件
- 3、测试代码
- 五、相关文章
- 六、总结
- 七、关于美化
原文链接:QCustomplot使用分享(九) 绘制图表-多功能游标
一、概述
上一篇文章QCustomplot使用分享(八) 层(完结)讲述了第一篇QCustomPlot控件的使用,主要是展示了多维度折线图,并且有一个简单的游标展示效果。本篇文章是在上一篇文章的基础上进行的功能加强,主要是针对游标进行优化,提供更加丰富的游标功能。
二、效果图
如下图所示,是我做的一个测试效果图,途中包括一个简单的折线图和一系列游标,折线图的显示模式有十几种效果,具体可以看QCustomplot使用分享(一) 能做什么事这篇文章里的截图,这里我就不在贴出。
这个效果图主要展示了游标的使用,其他相关功能可以参考之前写的文章,本篇文章最后也会通过相关文章小节提供,感兴趣的同学可以去文末查找。
演示demo中的数据是读取于cvs文件,如果大家自己想从其他渠道获取数据也可以,这个绘图控件已经添加了足够的接口可供调用。
绘图控件提供的游标功能如下,比如:
- 多种类游标,单游标,双游标
- 游标显示、隐藏,支持移动
- 双游标锁定移动,非锁定移动
- 获取游标区间值
- 设置游标颜色
- 获取游标区间数据
下面的文章中我会分析下主要的接口和核心功能实现
图中的展示效果测试代码如下,代码中的关键节点就2个
- 构造ESCvsDBOperater类,并加载cvs文件
- 通过Set接口设置数据,并设置折线图类型
ESCsvDBOperater * csvDBOperater = new ESCsvDBOperater(nullptr);
csvDBOperater->loadCSVFile(qApp->applicationDirPath() + "\\temp\\test31.csv");
QStringList names = csvDBOperater->getCSVNames();
auto callback = [this, names](const QString & name, const QVector<double> & data){
    int index = names.indexOf(name);
    if (index != -1)
    {
        if (index == 0)
        {
            ui->widget->SetGraphKey(data);
        }
        else
        {
            int l = name.indexOf("(");
            int r = name.indexOf(")");
            if (l != -1 && r != -1)
            {
                ui->widget->SetGraphValue(index - 1, name.left(l), /*name.mid(l + 1, r - l - 1)*/"", data);
                ui->widget->SetGraphScatterStyle(index - 1, 4);
            }
            else
            {
                ui->widget->SetGraphValue(index - 1, name, "", data);
            }
        }
    }
当然QCP不仅仅能显示折线图,他还可以显示各种各样的效果图,感兴趣的到QCustomplot使用分享(一) 能做什么事文章中观看
三、源码讲解
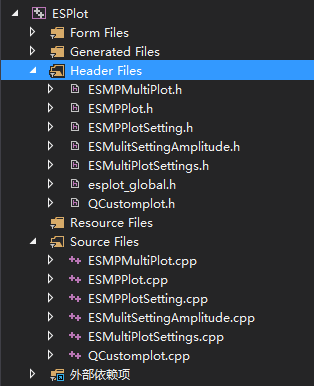
1、源码结构
如图所示,是工程的头文件截图,图中的文件数量比较多,但是对外我们使用的可能只是一个ESMPMultiPlot类,这个类中提供了很多接口,足够我们使用,当然了如果有特殊需求的话,可以进行提供定制
2、头文件
如下是头文件中的接口,我只是把相关的Public接口列出来了,而这些接口也正好是我们平时使用比较多的接口,看接口名称应该都知道接口是干什么的,因此不再细说
void ClearCache();//清空上一个csv绘图数据
void SetGraphCount(int);//设置折线图个数
void SetGraphKey(const QVector<double> &);//设置x轴数据
void SetGraphKeyRange(double, double);//设置x轴范围,即时间范围
void SetGraphScatterStyle(int, int);//设置折线图样式

void SetGraphValue(int, const QString &, const QString &
    , const QVector<double> &);//设置折线图数据
void AppendGraphValue(int, double, double);//追加折线图数据
void AppendGraphValue(int, const QVector<double> &, const QVector<double> &);//追加折线图数据

QVector<double> GetGraphValues(int, int);//获取折线图 游标区间值 参数1:折线下标 参数2:游标order

QString GetGraphName(int) const;
void SetGraphColor(int, const QColor &);//设置折线图颜色
QColor GetGraphColor(int);//获取折线图颜色

void SetSingleCursor(bool single);//启动单游标
bool IsSingleCursor(int index) const;//测试游标是否是单游标
void ShowCursor(bool visible = true);//设置游标是否显示
void AppendCursor(const QColor & color);//新增游标
void LockedCursor(int, bool);//锁定指定游标 参数2表示是否锁定
int CursorCount() const;
bool CursorVisible() const;//游标是否显示
void SetCursorColor(int index, const QColor &);//设置游标颜色 第二个参数指示哪个游标
double GetCursorKey(bool);//获取游标对象x轴值  true表示左游标  false表示右游标
double GetCursorKey(int index, bool);//获取游标对象x轴值  true表示左游标  false表示右游标

void ResizeKeyRange(bool, int index = 0);//设置x轴缩放  true时按游标缩放  false时恢复默认状态
void ResizeValueRange();//y轴自适应

void ConfigureGraph();//设置
void ConfigureGraphAmplitude(int);//双击右侧单位时触发
void SavePng(const QString & = "");//保存图片 1、分析时 自动执行并传入路径  2、点击保存图形按钮时 传空路径
3、添加游标
如下是模拟添加游标的代码,通过一个变量i来模拟不同情况,添加不同类型的游标,当前支持添加可移动单游标、可移动双游标、可锁定拖动双游标
- 单游标:单挑线,可以用鼠标进行拖拽
- 可移动双游标:两条线,分别移动,左边游标永远不会大于右边游标
- 可锁定拖动双游标:两条线,锁定移动,也就是说不管移动那条线,另一条线会同步移动,并一直在窗口内
void ESMultiPlot::on_pushButton_add_cursor_clicked()
{
    graphColor.append(Qt::red);
    graphColor.append(Qt::green);
    graphColor.append(Qt::blue);
    graphColor.append(Qt::gray);
    graphColor.append(Qt::cyan);
    graphColor.append(Qt::yellow);
    graphColor.append(Qt::magenta);

    static int i = 1;

    if (i % 3 == 0)
    {
        ui->widget->SetSingleCursor(true);
        ui->widget->AppendCursor(graphColor[rand() % 6 + 1]);
    }
    else if (i % 3 == 1)
    {
        ui->widget->SetSingleCursor(false);
        ui->widget->AppendCursor(graphColor[rand() % 6 + 1]);
        ui->widget->LockedCursor(i, false);
    }
    else
    {
        ui->widget->SetSingleCursor(false);
        ui->widget->AppendCursor(graphColor[rand() % 6 + 1]);
        ui->widget->LockedCursor(i, true);
    }
    ++i;
}
如上代码所示,SetSingleCursor设置为true时,表示接下来要添加的游标是单游标;LockedCursor可以锁定指定双游标,对单游标不生效。
4、监测移动
多游标模式下移动游标比一组游标复杂一些,我们需要循环监测所有的游标,并获取一个可移动游标。
这里获取移动游标的逻辑为距离鼠标按下的位置在5个像素以内的游标,并且优先响应先构造的游标,如果左右游标同时满足的话优先响应右游标
void ESMPMultiPlot::mousePressEvent(QMouseEvent * event)
{
    if (m_bCursor)
    {
        m_bDrag = true;
        for (int i = 0; i < m_pCursors.size(); ++i)
        {
            QCPItemStraightLine * leftCursor = m_pCursors.at(i).leftCursor;
            bool ispressed = false;
            double distance = leftCursor->selectTest(event->pos(), false);
            if (distance <= 5 && axisRect()->rect().contains(event->pos()))
            {
                m_bDragType = 1;
                m_bLeftCursor = true;
                ispressed = true;
                m_bLock = m_pCursors.at(i).lock;
                m_bSingleCursor = m_pCursors.at(i).single;
                m_bOrder = i;
            }

            QCPItemStraightLine * rightCursor = m_pCursors.at(i).rightCursor;
            distance = rightCursor->selectTest(event->pos(), false);
            if (distance <= 5 && axisRect()->rect().contains(event->pos()))
            {
                m_bDragType = 1;
                m_bLeftCursor = false;
                ispressed = true;
                m_bLock = m_pCursors.at(i).lock;
                m_bSingleCursor = m_pCursors.at(i).single;
                m_bOrder = i;
            }
            if (ispressed)
            {
                break;
            }
        }
    }

    for (int i = 0; i < m_vecNames.size(); ++i)
    {
        double distance = m_vecNames[i]->selectTest(event->pos(), false);
        //QPointF posF = m_vecNames[i]->position->pixelPosition;
        if (distance <= 13 && m_vecNames[i]->visible())
        {
            m_bDragType = 2;
            m_iDragIndex = i;
            break;
        }
    }

    __super::mousePressEvent(event);
}
5、移动游标
QCustomplot使用分享(八) 层(完结)文章讲述的是一组游标移动,移动游标时需要考虑的点比较少,分别是:
- 游标时不能移出界面
- 左游标必须小于右游标
本篇文章的多组游标移动相对来说考虑的点就需要更多一些,分别是:
游标默认值游标组(一个游标、或者两个游标);左右游标是针对两个游标而言
基础规则
- 游标不能移出界面
单游标
- 左侧为双游标时,与左侧右游标比,反之与左游标比
- 右侧直接与左游标比
双游标非锁定-移动左侧游标
- 左侧为双游标时,与左侧右游标比,反之与左游标比
- 右侧直接与右游标比
双游标非锁定-移动右侧游标
- 右侧直接与右侧游标左游标比
- 左侧直接与左游标比
双游标锁定
- 右移时,直接用右游标与右侧游标的左游标比
- 左移时,直接用左游标与左侧游标的右游标比
如下代码所示,是移动游标的核心代码,主要的移动情况,上边已经说了,下边移动逻辑就不在细说,感兴趣的同学可以自己查看,需要提供定制的可以加我QQ。
void ESMPMultiPlot::mouseMoveEvent(QMouseEvent * event)
{
if (m_bDragType == 1 && m_bDrag)
    {
        double pixelx = event->pos().x();
        QCPRange keyRange = axisRect()->axis(QCPAxis::atBottom)->range();
        double min = axisRect()->axis(QCPAxis::atBottom)->coordToPixel(keyRange.lower);
        double max = axisRect()->axis(QCPAxis::atBottom)->coordToPixel(keyRange.upper);

        if (min + 1 > pixelx)
        {
            pixelx = min + 1;
        }
        else if (max - 1 < pixelx)
        {
            pixelx = max - 1;
        }

        //按住左游标移动
        double move_distance = 0;
        double rcursor = m_pCursors[m_bOrder].rightCursor->point1->key();
        double rcursorx = axisRect()->axis(QCPAxis::atBottom)->coordToPixel(rcursor);

        double lcursor = m_pCursors[m_bOrder].leftCursor->point1->key();
        double lcursorx = axisRect()->axis(QCPAxis::atBottom)->coordToPixel(lcursor);

        if (m_bLeftCursor)
        {
            //修正左边
            if (m_bOrder != 0)
            {
                double rcursor;
                if (m_pCursors[m_bOrder - 1].rightCursor->visible())
                {
                    rcursor = m_pCursors[m_bOrder - 1].rightCursor->point1->key();
                }
                else//左侧是单游标
                {
                    rcursor = m_pCursors[m_bOrder - 1].leftCursor->point1->key();
                }
                double rcursorx = axisRect()->axis(QCPAxis::atBottom)->coordToPixel(rcursor);

                if (pixelx <= rcursorx + 4)
                {
                    pixelx = rcursorx + 4;
                }
                move_distance = rcursorx - pixelx;//可向左移动距离(向左为负)
            }
            else
            {
                if (pixelx <= min + 2)
                {
                    pixelx = min + 2;
                }
                move_distance = min - pixelx;//可向左移动距离(向左为负)
            }

            //修正右边
            if (m_bLock)//锁定移动
            {
                move_distance = pixelx - lcursorx;//往右准备移动的距离

                if (m_bOrder == m_pCursors.size() - 1)
                {
                    if (rcursorx + move_distance > max - 2)
                    {
                        move_distance = max - 2 - rcursorx;//往右真正可移动距离
                    }
                }
                else
                {
                    double nlcursor = m_pCursors[m_bOrder + 1].leftCursor->point1->key();
                    double nlcursorx = axisRect()->axis(QCPAxis::atBottom)->coordToPixel(nlcursor);
                    if (rcursorx + move_distance > nlcursorx - 4)
                    {
                        move_distance = nlcursorx - 4 - rcursorx;//往右真正可移动距离
                    }
                }
            }
            else
            {
                if (m_bSingleCursor)
                {
                    move_distance = pixelx - lcursorx;//往右准备移动的距离

                    if (m_bOrder == m_pCursors.size() - 1)
                    {
                        if (lcursorx + move_distance > max - 2)
                        {
                            move_distance = max - 2 - lcursorx;//往右真正可移动距离
                        }
                    }
                    else
                    {
                        double nlcursor = m_pCursors[m_bOrder + 1].leftCursor->point1->key();
                        double nlcursorx = axisRect()->axis(QCPAxis::atBottom)->coordToPixel(nlcursor);
                        if (lcursorx + move_distance > nlcursorx - 4)
                        {
                            move_distance = nlcursorx - 4 - lcursorx;//往右真正可移动距离
                        }
                    }
                }
                else
                {
                    if (pixelx >= rcursorx - 4)
                    {
                        pixelx = rcursorx - 4;
                    }
                    move_distance = pixelx - lcursorx;//可向右移动距离(向右为正)
                }
            }
        }
        else//按住右游标移动
        {
            //修正右边
            if (m_bOrder != m_pCursors.size() - 1)
            {
                double lcursor = m_pCursors[m_bOrder + 1].leftCursor->point1->key();
                double lcursorx = axisRect()->axis(QCPAxis::atBottom)->coordToPixel(lcursor);

                if (pixelx >= lcursorx - 4)
                {
                    pixelx = lcursorx - 4;
                }
                move_distance = pixelx - lcursorx;//可向右移动距离
            }
            else
            {
                if (pixelx >= max - 2)
                {
                    pixelx = max - 2;
                }
                move_distance = pixelx - lcursorx;//可向右移动距离
            }

            //修正左边
            if (m_bLock)//锁定移动
            {
                move_distance = pixelx - rcursorx;//往左准备移动的距离
                if (m_bOrder == 0)
                {
                    if (lcursorx + move_distance <= min + 2)
                    {
                        move_distance = min + 2 - lcursorx;//往左真正可移动距离
                    }
                }
                else
                {
                    double nlcursor = m_pCursors[m_bOrder - 1].rightCursor->point1->key();
                    double nlcursorx = axisRect()->axis(QCPAxis::atBottom)->coordToPixel(nlcursor);
                    if (lcursorx + move_distance <= nlcursorx + 4)
                    {
                        move_distance = nlcursorx + 4 - lcursorx;//往右真正可移动距离
                    }
                }
            }
            else
            {
                if (pixelx <= lcursorx + 4)
                {
                    pixelx = lcursorx + 4;
                }
                move_distance = pixelx - rcursorx;//可向左移动距离(向左为负)
            }
        }

        double key;
        if (m_bLeftCursor)
        {
            key = axisRect()->axis(QCPAxis::atBottom)->pixelToCoord(lcursorx + move_distance);
            m_pCursors[m_bOrder].leftCursor->point1->setCoords(key, m_pCursors[m_bOrder].leftCursor->point1->value());
            m_pCursors[m_bOrder].leftCursor->point2->setCoords(key, m_pCursors[m_bOrder].leftCursor->point2->value());
        }
        else
        {
            key = axisRect()->axis(QCPAxis::atBottom)->pixelToCoord(rcursorx + move_distance);
            m_pCursors[m_bOrder].rightCursor->point1->setCoords(key, m_pCursors[m_bOrder].rightCursor->point1->value());
            m_pCursors[m_bOrder].rightCursor->point2->setCoords(key, m_pCursors[m_bOrder].rightCursor->point2->value());
        }

        if (m_bLock)
        {
            if (m_bLeftCursor)
            {
                key = axisRect()->axis(QCPAxis::atBottom)->pixelToCoord(rcursorx + move_distance);
                m_pCursors[m_bOrder].rightCursor->point1->setCoords(key, m_pCursors[m_bOrder].rightCursor->point1->value());
                m_pCursors[m_bOrder].rightCursor->point2->setCoords(key, m_pCursors[m_bOrder].rightCursor->point2->value());
            }
            else
            {
                key = axisRect()->axis(QCPAxis::atBottom)->pixelToCoord(lcursorx + move_distance);
                m_pCursors[m_bOrder].leftCursor->point1->setCoords(key, m_pCursors[m_bOrder].leftCursor->point1->value());
                m_pCursors[m_bOrder].leftCursor->point2->setCoords(key, m_pCursors[m_bOrder].leftCursor->point2->value());
            }
        }

        event->accept();
        replot();

        emit CursorChanged(m_bLeftCursor);
        return;
    }
    else if (m_bDragType == 2)
    {
        double pixely = event->pos().y();
        QCPRange keyRange = axisRect()->axis(QCPAxis::atLeft)->range();
        double max = axisRect()->axis(QCPAxis::atLeft)->coordToPixel(keyRange.lower);
        double min = axisRect()->axis(QCPAxis::atLeft)->coordToPixel(keyRange.upper);
        if (min > pixely)
        {
            pixely = min;
        }
        else if (max < pixely)
        {
            pixely = max;
        }

        m_vecNames[m_iDragIndex]->position->setType(QCPItemPosition::ptPlotCoords);
        double coordy1 = axisRect()->axis(QCPAxis::atLeft)->pixelToCoord(pixely);
        double coordx = m_vecNames[m_iDragIndex]->position->coords().rx();
        double coordy = m_vecNames[m_iDragIndex]->position->coords().ry();
        m_vecNames[m_iDragIndex]->position->setCoords(coordx, coordy1);

        m_vecUnits[m_iDragIndex]->position->setType(QCPItemPosition::ptPlotCoords);
        m_vecUnits[m_iDragIndex]->position->setCoords(m_vecUnits[m_iDragIndex]->position->coords().rx(), coordy1);

        (*m_graphConfigure)[m_iDragIndex].position += (coordy1 - coordy);

        RefrushGraph(m_iDragIndex);

        event->accept();
        replot();
        return;
    }

    __super::mouseMoveEvent(event);
}
在ESMPPlot类中,m_mapLeftCursor和m_mapRightCursor分别是左右游标,为什么这里取了一个map呢?答案是:当时设计的时候是支持多个垂直摆放的游标可以进行游标同步,如果炒股的同学可能就会知道,k线和指标之间可能会有一个数值方便的线,不管在哪个绘图区进行移动,另一个图表里的线也会跟着移动
不了解这个的同学也不要紧,我们这个控件默认的就是一个表,因此这个map里也就只存了一个指,因此可以不关心这个问题
在ESMPMultiPlot类中,我们模拟了ESMPPlot的功能,这个时候呢?我们的坐标轴矩形只有一个了,x轴都是一样的,表示时间,对于不同曲线的y轴我们进行了平移,以达到不同的显示位置
这里边有一个很重的技巧,那就是我们对y轴数据进行了一次单位换算,让他显示的时候可以更好显示在我们制定的区域内,可能像下面这样
/*
    y1p=(y1-Yzero1)/Ygrid1+Xaxis1;%核心转换公式,将原始坐标值y1转换为新坐标值y1p
    y1;%原始数值
    Yzero1;%零点幅值,决定曲线1零点位置的变量
    Ygrid1;%单格幅值,决定曲线1每个单元格大小的量
    Xaxis1;%显示位置,决定曲线1在画图板中显示位置的变量
*/
当然了,我们转换后的坐标只是为了显示方便而已,如果我们根据UI获取原始值,我们还需要使用一个逆向公式进行转换回去。
6、其他函数
还有一些其他的方法,比如保存图表、获取图表坐标、设置图表颜色等这里就不细讲了,文章篇幅所限,不能一一的都贴出来,有需要的伙伴可以联系我,提供功能定制。
四、测试方式
1、测试工程
控件我们将的差不多了,这里把测试的代码放出来,大家参考下,首先测试工程截图如下所示,我们的测试代码,大多数都是写在了main函数中。

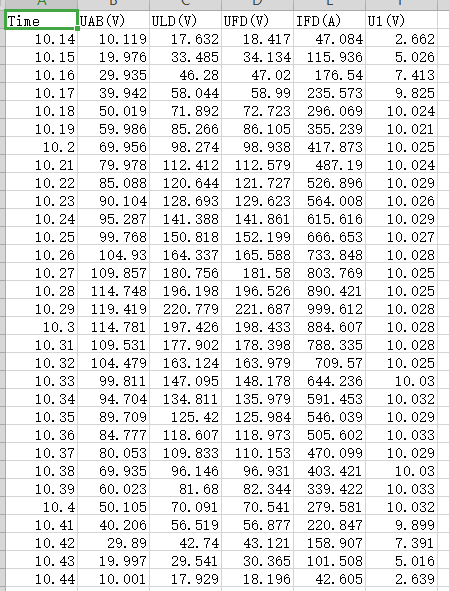
2、测试文件
这里简单说名下,我们的这个文件用途,第一列Time是代表了x轴的时间,而第二列开始的数据都是我们的折线图,一列数据代表一条折线图,并且列的名称就是我们折线图左侧的名称;列名称括号里的单位就是折线图右侧的单位。
3、测试代码
限于篇幅,这里我还是把无关的代码删减了很多,需要完整的源码的可以联系我。
void ESMPMultiPlot::LoadData()
{
    ESCsvDBOperater * csvDBOperater = new ESCsvDBOperater(nullptr);
    csvDBOperater->loadCSVFile(qApp->applicationDirPath() + "\\temp\\test31.csv");
    QStringList names = csvDBOperater->getCSVNames();

    auto callback = [this, names](const QString & name, const QVector<double> & data){
        添加图表数据
    };

    ui->widget->SetGraphCount(names.size() - 1);
    for (int i = 0; i < names.size(); ++i)
    {
        csvDBOperater->receiveData(names[i], callback);
    }

    double start = csvDBOperater->getStartTime();
    double end = csvDBOperater->getEndTime();

    csvDBOperater->receiveData(names[2], 10.201, 10.412, callback);
    QVector<double> tiems = csvDBOperater->getRangeTimeDatas(10.201, 10.412);

    ui->widget->SetGraphKeyRange(start, end);
}
五、相关文章
- QCustomplot使用分享(一) 能做什么事
- QCustomplot使用分享(二) 源码解读
- QCustomplot使用分享(三) 图
- QCustomplot使用分享(四) QCPAbstractItem
- QCustomplot使用分享(五) 布局
- QCustomplot使用分享(六) 坐标轴和网格线
- QCustomplot使用分享(七) 层(完结)
- QCustomplot使用分享(八) 层(完结)
六、总结
QCustomPlot是一个非常强大的绘图类,并且效率很高,对效率要求较高的程序都可以使用。
本篇文章是继前7篇讲解QCP后的第二篇使用案例,后续还会陆续提供更多复杂的功能。
这个控件已经被我封装成一个dll,如果有需要的小伙伴可以加我咨询
七、关于美化
因为我这里的程序都是测试程序,因此都是使用的原生效果,如果有需要美化的同学,或者客户,我也可以提供定制美化功能,欢迎咨询。
如果您觉得文章不错,不妨给个打赏,写作不易,感谢各位的支持。您的支持是我最大的动力,谢谢!!! |
 |
很重要--转载声明
本站文章无特别说明,皆为原创,版权所有,转载时请用链接的方式,给出原文出处。同时写上原作者:朝十晚八 or Twowords
如要转载,请原文转载,如在转载时修改本文,请事先告知,谢绝在转载时通过修改本文达到有利于转载者的目的。
原文链接:https://www.cnblogs.com/swarmbees/p/11745738.html
如有疑问请与原作者联系
标签:
版权申明:本站文章部分自网络,如有侵权,请联系:west999com@outlook.com
特别注意:本站所有转载文章言论不代表本站观点,本站所提供的摄影照片,插画,设计作品,如需使用,请与原作者联系,版权归原作者所有

下一篇:c++作业题sin公式
- C++ 在名称空间中使用using声明和using编译指令 2020-05-29
- 分享一个自己项目中用到的c++版的日志类(对初学者十分有用的 2020-05-22
- 1.ffmpeg、ffplay、ffprobe命令使用 2020-05-11
- 关于使用ffmpeg的一些牢骚 2020-05-08
- G++编译链接的那些事!G++的特殊使用方法[常用] 2020-04-19
IDC资讯: 主机资讯 注册资讯 托管资讯 vps资讯 网站建设
网站运营: 建站经验 策划盈利 搜索优化 网站推广 免费资源
网络编程: Asp.Net编程 Asp编程 Php编程 Xml编程 Access Mssql Mysql 其它
服务器技术: Web服务器 Ftp服务器 Mail服务器 Dns服务器 安全防护
软件技巧: 其它软件 Word Excel Powerpoint Ghost Vista QQ空间 QQ FlashGet 迅雷
网页制作: FrontPages Dreamweaver Javascript css photoshop fireworks Flash
