
Spring-Boot-应用可视化监控
2020-03-07 16:03:43来源:博客园 阅读 ()

Spring-Boot-应用可视化监控

图文简介


快速开始
1、Spring Boot 应用暴露监控指标【版本 1.5.7.RELEASE】
首先,添加依赖如下依赖:
        <dependency>
            <groupId>org.springframework.boot</groupId>
            <artifactId>spring-boot-starter-actuator</artifactId>
        </dependency>

        <dependency>
            <groupId>io.prometheus</groupId>
            <artifactId>simpleclient_spring_boot</artifactId>
            <version>0.0.26</version>
        </dependency>
然后,在启动类 Application.java 添加如下注解:
@SpringBootApplication
@EnablePrometheusEndpoint
@EnableSpringBootMetricsCollector
public class Application {

    public static void main(String[] args) {
        SpringApplication.run(Application.class, args);
    }

}
最后,配置默认的登录账号和密码,在 application.yml 中:
security:
  user:
    name: user
    password: pwd
提示:不建议配置
management.security.enabled: false
启动应用程序后,会看到如下一系列的 Mappings

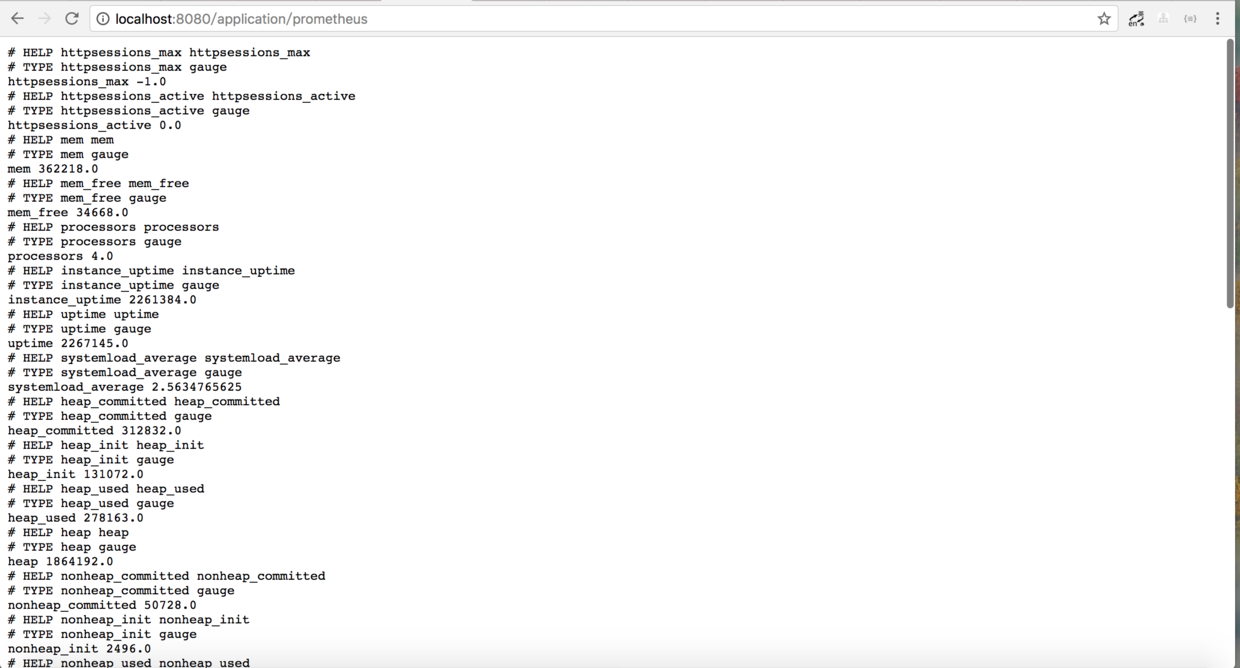
利用账号密码访问 http://localhost:8080/application/prometheus ,可以看到 Prometheus 格式的指标数据
2、Prometheus 采集 Spring Boot 指标数据
首先,获取 Prometheus 的 Docker 镜像:
$ docker pull prom/prometheus然后,编写配置文件 prometheus.yml :
global:
  scrape_interval: 10s
  scrape_timeout: 10s
  evaluation_interval: 10m
scrape_configs:
  - job_name: spring-boot
    scrape_interval: 5s
    scrape_timeout: 5s
    metrics_path: /application/prometheus
    scheme: http
    basic_auth:
      username: user
      password: pwd
    static_configs:
      - targets:
        - 127.0.0.1:8080  #此处填写 Spring Boot 应用的 IP + 端口号
接着,启动 Prometheus :
$ docker run -d \
--name prometheus \
-p 9090:9090 \
-m 500M \
-v "$(pwd)/prometheus.yml":/prometheus.yml \
-v "$(pwd)/data":/data \
prom/prometheus \
-config.file=/prometheus.yml \
-log.level=info
最后,访问 http://localhost:9090/targets , 检查 Spring Boot 采集状态是否正常。

3、Grafana 可视化监控数据
首先,获取 Grafana 的 Docker 镜像:
$ docker pull grafana/grafana然后,启动 Grafana:
$ docker run --name grafana -d -p 3000:3000 grafana/grafana接着,访问 http://localhost:3000/ 配置 Prometheus 数据源:
Grafana 登录账号 admin 密码 admin

最后,配置单个指标的可视化监控面板:


提示,此处不能任意填写,只能填已有的指标点,具体的可以在 Prometheus 的首页看到,即 http://localhost:9090/graph

多配置几个指标之后,即可有如下效果:

参考文档
- prometheus 官方文档
- Grafana Docker 安装
- Spring Boot 官方文档
文末福利
Java 资料大全 链接:https://pan.baidu.com/s/1pUCCPstPnlGDCljtBVUsXQ 密码:b2xc
更多资料: 2020 年 精选阿里 Java、架构、微服务精选资料等,加 v ? :qwerdd111
转载,请保留原文地址,谢谢 ~
原文链接:https://www.cnblogs.com/Alandre/p/12432867.html
如有疑问请与原作者联系
标签:
版权申明:本站文章部分自网络,如有侵权,请联系:west999com@outlook.com
特别注意:本站所有转载文章言论不代表本站观点,本站所提供的摄影照片,插画,设计作品,如需使用,请与原作者联系,版权归原作者所有

- 如何优雅地停止 Spring Boot 应用? 2020-06-08
- 详解SpringBoot(2.3)应用制作Docker镜像(官方方案) 2020-06-08
- 体验SpringBoot(2.3)应用制作Docker镜像(官方方案) 2020-06-07
- 如何在Spring Boot应用启动之后立刻执行一段逻辑?本文详解 2020-06-05
- 数据分析 | 数据可视化图表,BI工具构建逻辑 2020-06-02
IDC资讯: 主机资讯 注册资讯 托管资讯 vps资讯 网站建设
网站运营: 建站经验 策划盈利 搜索优化 网站推广 免费资源
网络编程: Asp.Net编程 Asp编程 Php编程 Xml编程 Access Mssql Mysql 其它
服务器技术: Web服务器 Ftp服务器 Mail服务器 Dns服务器 安全防护
软件技巧: 其它软件 Word Excel Powerpoint Ghost Vista QQ空间 QQ FlashGet 迅雷
网页制作: FrontPages Dreamweaver Javascript css photoshop fireworks Flash
