
解决微信小程序引用echarts视图模糊的问题
2020-04-24 16:00:39来源:博客园 阅读 ()

解决微信小程序引用echarts视图模糊的问题
在小程序项目中需要用到echarts图表
但是展示的时候遇到了问题 图表高度失真 体验感非常差

经过一番查找实验,终于找到了解决方案
下面上代码!
function initChart(canvas, width, height,dpr) { const chart = echarts.init(canvas, null, { width: width, height: height, devicePixelRatio: dpr //解决小程序视图模糊的问题,必写 }); canvas.setChart(chart); var checkName = '今天'; var dataLength = 14; //默认的数据长度,既真实数组的长度,必须设置,长度来源:后台传输 //这里是echart基础配置 var option = { backgroundColor: 'rgba(25,1,169,.05)', tooltip: { trigger: 'axis', axisPointer: { type: 'shadow', backgroundColor: 'rgba(245, 245, 245, 1)', borderWidth: 1, // padding: 10, } }, dataZoom: [{ show: false, //是否显示下方滚动条 realtime: true, startValue: dataLength - 7, endValue: dataLength - 1, //显示数据结束位置 }, { type: 'inside', realtime: true, startValue: dataLength - 7, endValue: dataLength - 1, //显示数据结束位置 } ], grid: { top: '20%', right: '0', left: '0', bottom: '12%' }, xAxis: [{ type: 'category', data: ['02.25', '02.26', '02.27', '02.28', '03.01', '03.02', '03.02', '02.25', '02.26', '02.27', '02.28', '03.01', '03.02', '今天'], axisLine: { lineStyle: { color: 'rgba(255,255,255,0.12)' } }, position: 'top', axisLabel: { color: function(params) { //通过判断选中的名字改变柱子的颜色样式 if (checkName === params) { return 'rgba(38,74,255,1)'; } else { return 'rgba(38,74,255,.3)'; } }, textStyle: { fontSize: 14 }, padding: [10, 0]},
}], yAxis: [{ show: false, axisLabel: { formatter: '{value}', color: '#e2e9ff', }, axisLine: { show: false }, splitLine: { lineStyle: { color: 'rgba(255,255,255,0.12)' } } }], series: [{ type: 'bar', data: [300, 450, 770, 203, 255, 188, 156, 300, 450, 770, 203, 255, 188, 156], // itemStyle: { // normal: { // color: 'rgba(38,74,255,.3)', // } // }, itemStyle: { normal: { label: { show: true }, color: function(params) { //通过判断选中的名字改变柱子的颜色样式 if (checkName === params.name) { return 'rgba(38,74,255,1)'; } else { return 'rgba(38,74,255,.3)'; } } }
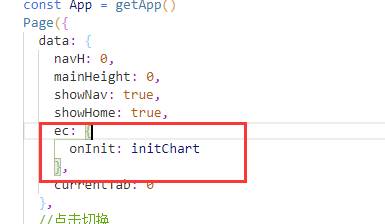
}, label: { normal: { show: true, position: 'top', textStyle: { color: '#B9C5FC', fontSize: '12' }, formatter: '{c}分' } } }] }; chart.setOption(option); return chart; } 在小程序的data里面调用
这样就解决了 解决后的效果图

原文链接:https://www.cnblogs.com/smlblog/p/12739327.html
如有疑问请与原作者联系
标签:
版权申明:本站文章部分自网络,如有侵权,请联系:west999com@outlook.com
特别注意:本站所有转载文章言论不代表本站观点,本站所提供的摄影照片,插画,设计作品,如需使用,请与原作者联系,版权归原作者所有

下一篇:【Vue】路由
- 如此沙雕的代码注释,原来程序员都是段子手 2020-06-08
- 还在羡慕程序员工资高吗?看完这篇前端学习计划,你也可以拿 2020-05-23
- 想成为一个高薪WEB前端程序员,这些书籍你要看 2020-05-22
- 1W2以下前端程序员该如何面对现实?我这有一套让你提升的方 2020-05-22
- 在web开发中,为什么前端比后端更得到转行程序员的青睐?必 2020-05-15
IDC资讯: 主机资讯 注册资讯 托管资讯 vps资讯 网站建设
网站运营: 建站经验 策划盈利 搜索优化 网站推广 免费资源
网络编程: Asp.Net编程 Asp编程 Php编程 Xml编程 Access Mssql Mysql 其它
服务器技术: Web服务器 Ftp服务器 Mail服务器 Dns服务器 安全防护
软件技巧: 其它软件 Word Excel Powerpoint Ghost Vista QQ空间 QQ FlashGet 迅雷
网页制作: FrontPages Dreamweaver Javascript css photoshop fireworks Flash
