
TChart-图表编辑器的测试
2020-02-20 16:01:17来源:博客园 阅读 ()

TChart-图表编辑器的测试
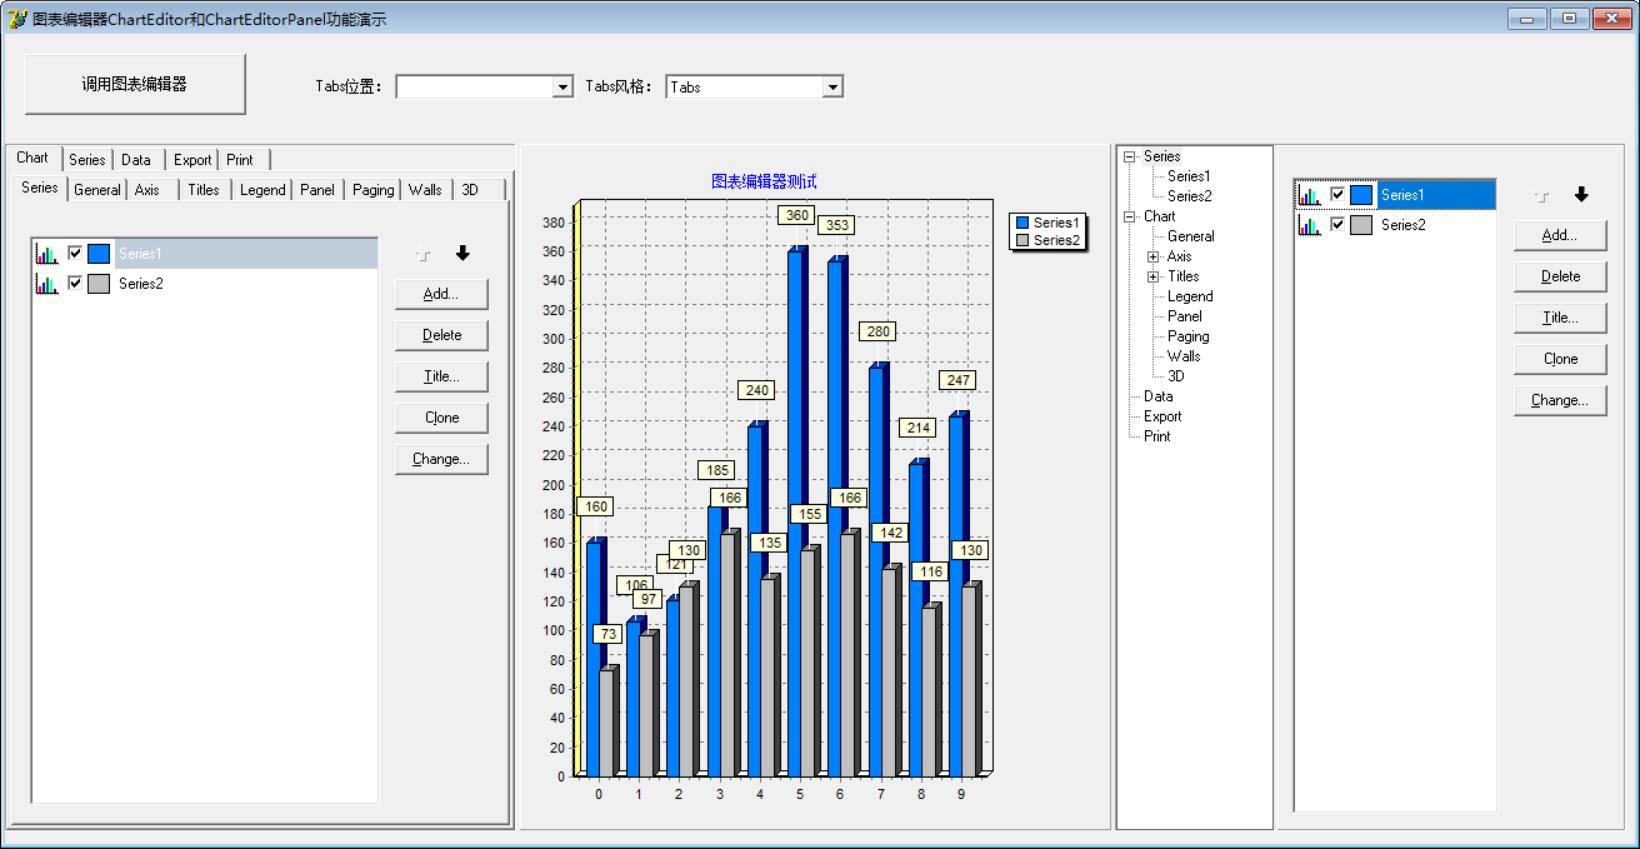
最近不知怎么的,想研究一下图表。先上效果图:
功能代码:


unit Unit1;

interface

uses
  Windows, Messages, SysUtils, Variants, Classes, Graphics, Controls, Forms,
  Dialogs, TeeEdit, ExtCtrls, TeeProcs, TeEngine, Series, Chart, StdCtrls,
  ComCtrls;

type
  TForm1 = class(TForm)
    ChartEditorPanel1: TChartEditorPanel;
    ChartEditor1: TChartEditor;
    ChartEditorPanel2: TChartEditorPanel;
    Chart1: TChart;
    Series1: TBarSeries;
    Series2: TBarSeries;
    Button1: TButton;
    ComboBox1: TComboBox;
    Label1: TLabel;
    ComboBox2: TComboBox;
    Label2: TLabel;
    procedure FormCreate(Sender: TObject);
    procedure Button1Click(Sender: TObject);
    procedure ComboBox1Change(Sender: TObject);
    procedure ComboBox2Change(Sender: TObject);
    procedure Chart1ClickAxis(Sender: TCustomChart; Axis: TChartAxis;
      Button: TMouseButton; Shift: TShiftState; X, Y: Integer);
    procedure Chart1ClickLegend(Sender: TCustomChart; Button: TMouseButton;
      Shift: TShiftState; X, Y: Integer);
  private
    { Private declarations }
  public
    { Public declarations }
  end;

var
  Form1: TForm1;

implementation

{$R *.dfm}

procedure TForm1.FormCreate(Sender: TObject);
begin
  Self.Position := poScreenCenter;
  //右下角图表编辑器树形显示
  ChartEditorPanel2.Editor.Tree.Visible := True;
  //随机添加10个数
  Series1.FillSampleValues(10);
  Series2.FillSampleValues(10);
end;

procedure TForm1.Button1Click(Sender: TObject);
begin
  ChartEditor1.Execute;
end;

procedure TForm1.ComboBox1Change(Sender: TObject);
var
  Pos: TTabPosition;
begin
  Pos := tpTop;
  case ComboBox1.ItemIndex of
    0: Pos := tpTop;
    1: Pos := tpBottom;
    2: Pos := tpLeft;
    3: Pos := tpRight;
  end;
  ChartEditorPanel1.Editor.TabGeneral.PageControl.TabPosition := Pos;
end;

procedure TForm1.ComboBox2Change(Sender: TObject);
var
  ts: TTabStyle;
begin
  ts := tsTabs;
  case ComboBox2.ItemIndex of
    0: ts := tsTabs;
    1: ts := tsButtons;
    2: ts := tsFlatButtons;
  end;
  ChartEditorPanel1.Editor.TabGeneral.PageControl.Style := ts;
end;

procedure TForm1.Chart1ClickAxis(Sender: TCustomChart; Axis: TChartAxis;
  Button: TMouseButton; Shift: TShiftState; X, Y: Integer);
begin
  ChartEditorPanel1.Editor.TabAxis.Show;
  ChartEditorPanel1.Editor.TabAxis.PageControl.ActivePage.PageIndex;
end;

procedure TForm1.Chart1ClickLegend(Sender: TCustomChart;
  Button: TMouseButton; Shift: TShiftState; X, Y: Integer);
begin
  ChartEditorPanel1.Editor.TabLegend.Show;
end;

end.
View Code
界面代码:
object Form1: TForm1
  Left = 304
  Top = 219
  Width = 1312
  Height = 679
  Caption = '图表编辑器ChartEditor和ChartEditorPanel功能演示'
  Color = clBtnFace
  Font.Charset = DEFAULT_CHARSET
  Font.Color = clWindowText
  Font.Height = -11
  Font.Name = 'MS Sans Serif'
  Font.Style = []
  OldCreateOrder = False
  OnCreate = FormCreate
  PixelsPerInch = 96
  TextHeight = 13
  object Label1: TLabel
    Left = 248
    Top = 35
    Width = 60
    Height = 13
    Caption = 'Tabs位置:'
  end
  object Label2: TLabel
    Left = 464
    Top = 35
    Width = 60
    Height = 13
    Caption = 'Tabs风格:'
  end
  object ChartEditorPanel1: TChartEditorPanel
    Left = 0
    Top = 88
    Width = 409
    Height = 550
    Chart = Chart1
    TabOrder = 0
  end
  object ChartEditorPanel2: TChartEditorPanel
    Left = 888
    Top = 88
    Width = 409
    Height = 550
    Chart = Chart1
    TabOrder = 1
  end
  object Chart1: TChart
    Left = 412
    Top = 88
    Width = 473
    Height = 549
    Title.Text.Strings = (
      '图表编辑器测试')
    OnClickAxis = Chart1ClickAxis
    OnClickLegend = Chart1ClickLegend
    TabOrder = 2
    object Series1: TBarSeries
      Marks.Callout.Brush.Color = clBlack
      Marks.Visible = True
      SeriesColor = 16744448
      Gradient.Direction = gdTopBottom
      XValues.Name = 'X'
      XValues.Order = loAscending
      YValues.Name = 'Bar'
      YValues.Order = loNone
    end
    object Series2: TBarSeries
      Marks.Callout.Brush.Color = clBlack
      Marks.Visible = True
      SeriesColor = clSilver
      Gradient.Direction = gdTopBottom
      XValues.Name = 'X'
      XValues.Order = loAscending
      YValues.Name = 'Bar'
      YValues.Order = loNone
    end
  end
  object Button1: TButton
    Left = 16
    Top = 16
    Width = 177
    Height = 49
    Caption = '调用图表编辑器'
    TabOrder = 3
    OnClick = Button1Click
  end
  object ComboBox1: TComboBox
    Left = 312
    Top = 32
    Width = 145
    Height = 21
    Style = csDropDownList
    ItemHeight = 13
    TabOrder = 4
    OnChange = ComboBox1Change
    Items.Strings = (
      'Top'
      'Bottom'
      'Left'
      'Right')
  end
  object ComboBox2: TComboBox
    Left = 528
    Top = 32
    Width = 145
    Height = 21
    Style = csDropDownList
    ItemHeight = 13
    ItemIndex = 0
    TabOrder = 5
    Text = 'Tabs'
    OnChange = ComboBox2Change
    Items.Strings = (
      'Tabs'
      'Buttons'
      'FlatButtons')
  end
  object ChartEditor1: TChartEditor
    Chart = Chart1
    Left = 856
    Top = 64
  end
end
View Code
原文链接:https://www.cnblogs.com/adsoft/p/12337149.html
如有疑问请与原作者联系
标签:
版权申明:本站文章部分自网络,如有侵权,请联系:west999com@outlook.com
特别注意:本站所有转载文章言论不代表本站观点,本站所提供的摄影照片,插画,设计作品,如需使用,请与原作者联系,版权归原作者所有

- TChart-序列类工具功能演示 2020-03-08
- TChart-对象查看器与打印预览 2020-02-29
- TChart-图表的滚动与翻译 2020-02-26
- TChart-数据编辑(TChartListBox,TeeCommander) 2020-02-21
- Csharp: FreeTextbox 编辑器控件运行时错误: 'FTB_R 2018-06-17
IDC资讯: 主机资讯 注册资讯 托管资讯 vps资讯 网站建设
网站运营: 建站经验 策划盈利 搜索优化 网站推广 免费资源
网络编程: Asp.Net编程 Asp编程 Php编程 Xml编程 Access Mssql Mysql 其它
服务器技术: Web服务器 Ftp服务器 Mail服务器 Dns服务器 安全防护
软件技巧: 其它软件 Word Excel Powerpoint Ghost Vista QQ空间 QQ FlashGet 迅雷
网页制作: FrontPages Dreamweaver Javascript css photoshop fireworks Flash
